Page 54 - KWAP_AR2022
P. 54

52             KUMPULAN WANG PERSARAAN (DIPERBADANKAN)  foR BEttER vALUE DELIvERy


                                                   TOWARDS MORE
                                             SUSTAINABLE TOMORROWS


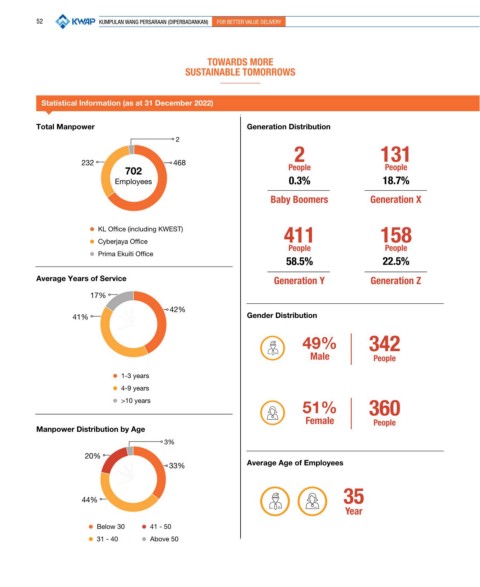
           Statistical Information (as at 31 December 2022)

          Total Manpower                                    Generation Distribution
                                           2
                                                                       2                    131
                    232                   468
                               702                                    People                 People
                            Employees                                 0.3%                  18.7%

                                                                  Baby Boomers           Generation X


                      •  KL Office (including KWEST)                                        158
                      •  Cyberjaya Office                            411
                      •  Prima Ekuiti Office                          People                 People
                                                                     58.5%                  22.5%

          Average Years of Service                                Generation Y           Generation Z
                      17%

                                         42%
                  41%                                       Gender Distribution


                                                                         49%             342
                                                                           Male           People

                            •  1-3 years
                            •  4-9 years
                            •  >10 years
                                                                         51%             360
                                                                          Female          People
          Manpower Distribution by Age
                                        3%
                     20%
                                         33%                Average Age of Employees


                                                                                   35
                    44%
                                                                                   Year

                      •  Below 30  •  41 - 50
                      •  31 - 40   •  Above 50
   49   50   51   52   53   54   55   56   57   58   59