
Page 63 - KWAP_AR2022
P. 63
FoR betteR PeRFoRmAnce Annual Report 2022 61
LOANS INTERNATIONAL FIXED INCOME
KWAP’s exposure in loan stood at 0.6% of total investment As at 31 December 2022, KWAP’s international fixed
assets as at 31 December 2022. No new loan was disbursed income portfolio’s market value stood at 0.3% as compared
for year 2022. Loan holdings were reduced significantly by to 0.4% in 2021, of total investment assets. Given the
RM1.97 billion due to maturity and capital repayment of elevated interest rates globally, the TWRR for international
outstanding loans. KWAP’s loan portfolio recorded a return fixed income portfolio came in at -6.53%. In anticipation
in TWRR of 6.31%, with an outperformance of 186 basis
points in 2022. of global central banks embarking on their hiking cycles,
which may result in higher bond yields, KWAP has been
Furthermore, income generated from the loan portfolio for reducing its exposure to international bonds and waiting for
year 2022 was RM106.63 million, in line with the shrinking an opportunistic time to re-enter the market. Our portfolio
of loan portfolio size in 2022. remain well diversified in terms of geography and currency
as we remain invested in across seven countries and six
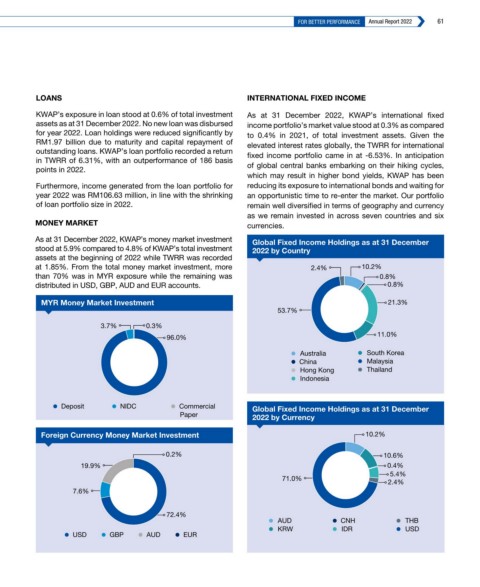
MONEY MARKET currencies.
As at 31 December 2022, KWAP’s money market investment Global Fixed Income Holdings as at 31 December
stood at 5.9% compared to 4.8% of KWAP’s total investment 2022 by Country
assets at the beginning of 2022 while TWRR was recorded
at 1.85%. From the total money market investment, more 2.4% 10.2%
than 70% was in MYR exposure while the remaining was 0.8%
distributed in USD, GBP, AUD and EUR accounts. 0.8%
MYR Money Market Investment 21.3%
53.7%
3.7% 0.3%
96.0% 11.0%
• Australia • South Korea
• China • Malaysia
• Hong Kong • Thailand
• Indonesia
• Deposit • NIDC • Commercial Global Fixed Income Holdings as at 31 December
Paper 2022 by Currency
Foreign Currency Money Market Investment 10.2%
0.2% 10.6%
19.9% 0.4%
5.4%
71.0% 2.4%
7.6%
72.4%
• AUD • CNH • THB
• USD • GBP • AUD • EUR • KRW • IDR • USD