
Page 181 - KWAP_Integrated-Report_2023
P. 181
ENRICHING STAKEHOLDER ASPIRATIONS ENRICHING PERFORMANCE ENRICHING THE COMMUNITY ENRICHING ACCOUNTABILITY & INTEGRITY ENRICHING RESILIENCE & SUSTAINABLE GROWTH
NOTES TO THE FINANCIAL STATEMENTS
FOR THE YEAR ENDED 31 DECEMBER 2023
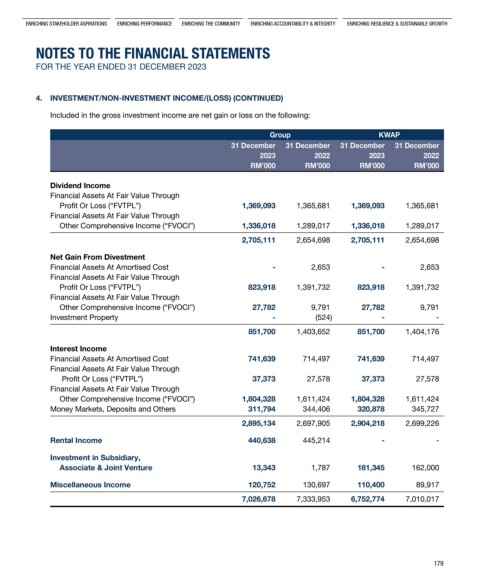
4. INVESTMENT/NON-INVESTMENT INCOME/(LOSS) (CONTINUED)
included in the gross investment income are net gain or loss on the following:
Group KWAP
31 December 31 December 31 December 31 December
2023 2022 2023 2022
RM’000 RM’000 RM’000 RM’000
Dividend Income
financial assets at fair Value through
profit or loss (“fVtpl”) 1,369,093 1,365,681 1,369,093 1,365,681
financial assets at fair Value through
other comprehensive income (“fVoci”) 1,336,018 1,289,017 1,336,018 1,289,017
2,705,111 2,654,698 2,705,111 2,654,698
Net Gain From Divestment
financial assets at amortised cost - 2,653 - 2,653
financial assets at fair Value through
profit or loss (“fVtpl”) 823,918 1,391,732 823,918 1,391,732
financial assets at fair Value through
other comprehensive income (“fVoci”) 27,782 9,791 27,782 9,791
investment property - (524) - -
851,700 1,403,652 851,700 1,404,176
Interest Income
financial assets at amortised cost 741,639 714,497 741,639 714,497
financial assets at fair Value through
profit or loss (“fVtpl”) 37,373 27,578 37,373 27,578
financial assets at fair Value through
other comprehensive income (“fVoci”) 1,804,328 1,611,424 1,804,328 1,611,424
money markets, deposits and others 311,794 344,406 320,878 345,727
2,895,134 2,697,905 2,904,218 2,699,226
Rental Income 440,638 445,214 - -
Investment in Subsidiary,
Associate & Joint Venture 13,343 1,787 181,345 162,000
Miscellaneous Income 120,752 130,697 110,400 89,917
7,026,678 7,333,953 6,752,774 7,010,017
179