
Page 147 - KWAP_Integrated-Report_2023
P. 147
ENRICHING STAKEHOLDER ASPIRATIONS ENRICHING PERFORMANCE ENRICHING THE COMMUNITY ENRICHING ACCOUNTABILITY & INTEGRITY ENRICHING RESILIENCE & SUSTAINABLE GROWTH
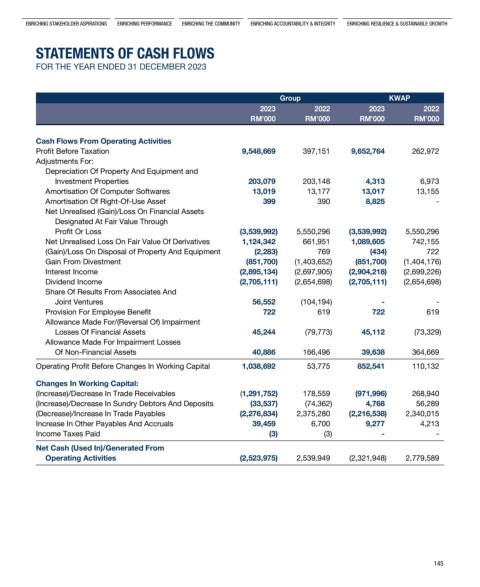
StatementS Of CaSh flOwS
FOR ThE yEAR ENDED 31 DECEMBER 2023
Group KWAP
2023 2022 2023 2022
RM’000 RM’000 RM’000 RM’000
Cash Flows From Operating Activities
Profit Before Taxation 9,548,669 397,151 9,652,764 262,972
Adjustments For:
Depreciation Of Property And Equipment and
Investment Properties 203,079 203,148 4,313 6,973
Amortisation Of Computer Softwares 13,019 13,177 13,017 13,155
Amortisation Of Right-Of-Use Asset 399 390 8,825 -
Net Unrealised (Gain)/Loss On Financial Assets
Designated At Fair Value Through
Profit Or Loss (3,539,992) 5,550,296 (3,539,992) 5,550,296
Net Unrealised Loss On Fair Value Of Derivatives 1,124,342 661,951 1,089,605 742,155
(Gain)/Loss On Disposal of Property And Equipment (2,283) 769 (434) 722
Gain From Divestment (851,700) (1,403,652) (851,700) (1,404,176)
Interest Income (2,895,134) (2,697,905) (2,904,218) (2,699,226)
Dividend Income (2,705,111) (2,654,698) (2,705,111) (2,654,698)
Share Of Results From Associates And
Joint Ventures 56,552 (104,194) - -
Provision For Employee Benefit 722 619 722 619
Allowance Made For/(Reversal Of) Impairment
Losses Of Financial Assets 45,244 (79,773) 45,112 (73,329)
Allowance Made For Impairment Losses
Of Non-Financial Assets 40,886 166,496 39,638 364,669
Operating Profit Before Changes In Working Capital 1,038,692 53,775 852,541 110,132
Changes In Working Capital:
(Increase)/Decrease In Trade Receivables (1,291,752) 178,559 (971,996) 268,940
(Increase)/Decrease In Sundry Debtors And Deposits (33,537) (74,362) 4,768 56,289
(Decrease)/Increase In Trade Payables (2,276,834) 2,375,280 (2,216,538) 2,340,015
Increase In Other Payables And Accruals 39,459 6,700 9,277 4,213
Income Taxes Paid (3) (3) - -
Net Cash (Used In)/Generated From
Operating Activities (2,523,975) 2,539,949 (2,321,948) 2,779,589
145