
Page 143 - KWAP_Integrated-Report_2023
P. 143
ENRICHING STAKEHOLDER ASPIRATIONS ENRICHING PERFORMANCE ENRICHING THE COMMUNITY ENRICHING ACCOUNTABILITY & INTEGRITY ENRICHING RESILIENCE & SUSTAINABLE GROWTH
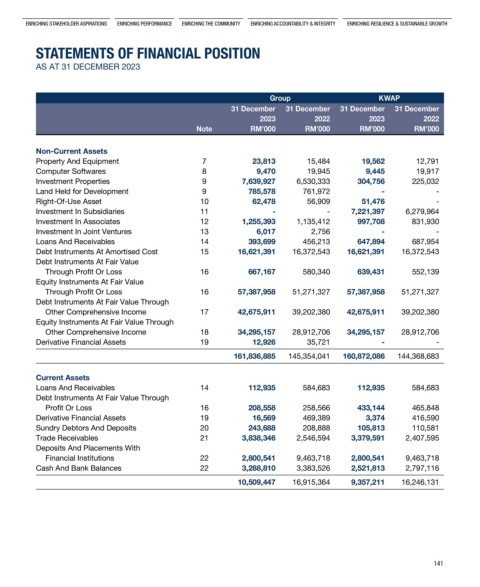
statements of financial position
as at 31 december 2023
Group KWAP
31 December 31 December 31 December 31 December
2023 2022 2023 2022
Note RM’000 RM’000 RM’000 RM’000
Non-Current Assets
property and equipment 7 23,813 15,484 19,562 12,791
computer softwares 8 9,470 19,945 9,445 19,917
investment properties 9 7,639,927 6,530,333 304,756 225,032
land held for development 9 785,578 761,972 - -
right-of-use asset 10 62,478 56,909 51,476 -
investment in subsidiaries 11 - - 7,221,397 6,279,964
investment in associates 12 1,255,393 1,135,412 997,708 831,930
investment in Joint Ventures 13 6,017 2,756 - -
loans and receivables 14 393,699 456,213 647,894 687,954
debt instruments at amortised cost 15 16,621,391 16,372,543 16,621,391 16,372,543
debt instruments at fair Value
through profit or loss 16 667,167 580,340 639,431 552,139
equity instruments at fair Value
through profit or loss 16 57,387,958 51,271,327 57,387,958 51,271,327
debt instruments at fair Value through
other comprehensive income 17 42,675,911 39,202,380 42,675,911 39,202,380
equity instruments at fair Value through
other comprehensive income 18 34,295,157 28,912,706 34,295,157 28,912,706
derivative financial assets 19 12,926 35,721 - -
161,836,885 145,354,041 160,872,086 144,368,683
Current Assets
loans and receivables 14 112,935 584,683 112,935 584,683
debt instruments at fair Value through
profit or loss 16 208,558 258,566 433,144 465,848
derivative financial assets 19 16,569 469,389 3,374 416,590
sundry debtors and deposits 20 243,688 208,888 105,813 110,581
trade receivables 21 3,838,346 2,546,594 3,379,591 2,407,595
deposits and placements With
financial institutions 22 2,800,541 9,463,718 2,800,541 9,463,718
cash and bank balances 22 3,288,810 3,383,526 2,521,813 2,797,116
10,509,447 16,915,364 9,357,211 16,246,131
141