Page 249 - KWAP_AR2022
P. 249

FoR BetteR RetuRns  Annual Report 2022  247


                                                    notes to the
                                               financial statements
                                          for the year ended 31 december 2022


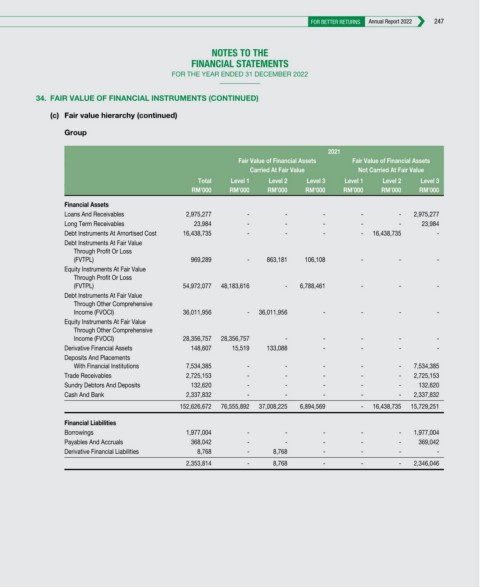
          34.  FAIR VALUE OF FINANCIAL INSTRUMENTS (CONTINUED)
             (c)  Fair value hierarchy (continued)

                Group

                                                                               2021
                                                          Fair Value of Financial Assets   Fair Value of Financial Assets
                                                             Carried At Fair Value     Not Carried At Fair Value
                                                Total   Level 1   Level 2   Level 3   Level 1   Level 2   Level 3
                                               RM’000   RM’000   RM’000   RM’000   RM’000   RM’000   RM’000
                Financial Assets
                loans and receivables        2,975,277      -        -        -        -        -   2,975,277
                long term receivables          23,984       -        -        -        -        -     23,984
                debt instruments at amortised cost  16,438,735  -    -        -        -  16,438,735     -
                debt instruments at fair Value
                   through profit or loss
                   (fVtpl)                     969,289      -    863,181   106,108     -        -        -
                equity instruments at fair Value
                   through profit or loss
                   (fVtpl)                   54,972,077  48,183,616  -   6,788,461     -        -        -
                debt instruments at fair Value
                   through other comprehensive
                   income (fVoci)            36,011,956     -  36,011,956     -        -        -        -
                equity instruments at fair Value
                   through other comprehensive
                   income (fVoci)            28,356,757  28,356,757  -        -        -        -        -
                derivative financial assets    148,607  15,519   133,088      -        -        -        -
                deposits and placements
                   With financial institutions  7,534,385   -        -        -        -        -   7,534,385
                trade receivables            2,725,153      -        -        -        -        -   2,725,153
                sundry debtors and deposits    132,620      -        -        -        -        -    132,620
                cash and bank                2,337,832      -        -        -        -        -   2,337,832
                                            152,626,672  76,555,892  37,008,225  6,894,569  -  16,438,735  15,729,251
                Financial Liabilities
                borrowings                   1,977,004      -        -        -        -        -   1,977,004
                payables and accruals          368,042      -        -        -        -        -    369,042
                derivative financial liabilities  8,768     -     8,768       -        -        -        -
                                             2,353,814      -     8,768       -        -        -   2,346,046
   244   245   246   247   248   249   250   251   252   253   254