
Page 253 - KWAP_Integrated-Report_2023
P. 253
ENRICHING STAKEHOLDER ASPIRATIONS ENRICHING PERFORMANCE ENRICHING THE COMMUNITY ENRICHING ACCOUNTABILITY & INTEGRITY ENRICHING RESILIENCE & SUSTAINABLE GROWTH
NOTES TO THE FINANCIAL STATEMENTS
FOR THE YEAR ENDED 31 DECEMBER 2023
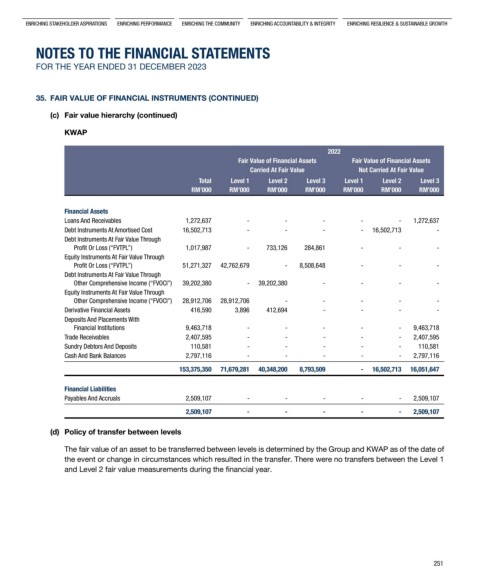
35. FAIR VALUE OF FINANCIAL INSTRUMENTS (CONTINUED)
(c) Fair value hierarchy (continued)
KWAP
2022
fair value of financial assets fair value of financial assets
carried at fair value not carried at fair value
total level 1 level 2 level 3 level 1 level 2 level 3
rm’000 rm’000 rm’000 rm’000 rm’000 rm’000 rm’000
financial assets
Loans And Receivables 1,272,637 - - - - - 1,272,637
Debt Instruments At Amortised Cost 16,502,713 - - - - 16,502,713 -
Debt Instruments At Fair Value Through
Profit Or Loss (“FVTPL”) 1,017,987 - 733,126 284,861 - - -
Equity Instruments At Fair Value Through
Profit Or Loss (“FVTPL”) 51,271,327 42,762,679 - 8,508,648 - - -
Debt Instruments At Fair Value Through
Other Comprehensive Income (“FVOCI”) 39,202,380 - 39,202,380 - - - -
Equity Instruments At Fair Value Through
Other Comprehensive Income (“FVOCI”) 28,912,706 28,912,706 - - - - -
Derivative Financial Assets 416,590 3,896 412,694 - - - -
Deposits And Placements With
Financial Institutions 9,463,718 - - - - - 9,463,718
Trade Receivables 2,407,595 - - - - - 2,407,595
Sundry Debtors And Deposits 110,581 - - - - - 110,581
Cash And Bank Balances 2,797,116 - - - - - 2,797,116
153,375,350 71,679,281 40,348,200 8,793,509 - 16,502,713 16,051,647
financial liabilities
Payables And Accruals 2,509,107 - - - - - 2,509,107
2,509,107 - - - - - 2,509,107
(d) Policy of transfer between levels
the fair value of an asset to be transferred between levels is determined by the group and KWap as of the date of
the event or change in circumstances which resulted in the transfer. there were no transfers between the level 1
and level 2 fair value measurements during the financial year.
251