
Page 140 - KWAP_AR2022
P. 140
138 KUMPULAN WANG PERSARAAN (DIPERBADANKAN) FoR BEttER REtURNS
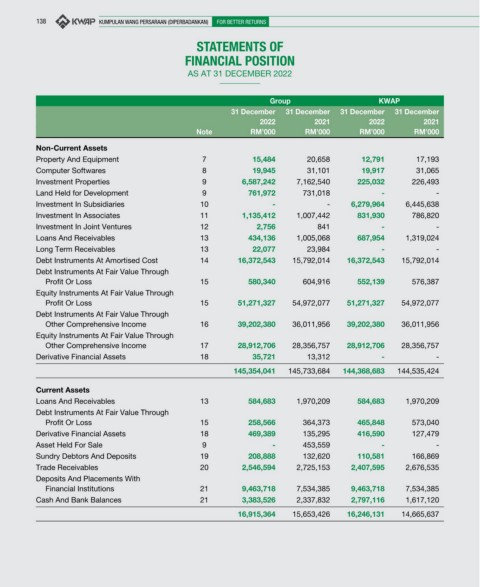
statements of
financial position
as at 31 december 2022
Group KWAP
31 December 31 December 31 December 31 December
2022 2021 2022 2021
Note RM’000 RM’000 RM’000 RM’000
Non-Current Assets
property and equipment 7 15,484 20,658 12,791 17,193
computer softwares 8 19,945 31,101 19,917 31,065
investment properties 9 6,587,242 7,162,540 225,032 226,493
land held for development 9 761,972 731,018 - -
investment in subsidiaries 10 - - 6,279,964 6,445,638
investment in associates 11 1,135,412 1,007,442 831,930 786,820
investment in Joint Ventures 12 2,756 841 - -
loans and receivables 13 434,136 1,005,068 687,954 1,319,024
long term receivables 13 22,077 23,984 - -
debt instruments at amortised cost 14 16,372,543 15,792,014 16,372,543 15,792,014
debt instruments at fair Value through
profit or loss 15 580,340 604,916 552,139 576,387
equity instruments at fair Value through
profit or loss 15 51,271,327 54,972,077 51,271,327 54,972,077
debt instruments at fair Value through
other comprehensive income 16 39,202,380 36,011,956 39,202,380 36,011,956
equity instruments at fair Value through
other comprehensive income 17 28,912,706 28,356,757 28,912,706 28,356,757
derivative financial assets 18 35,721 13,312 - -
145,354,041 145,733,684 144,368,683 144,535,424
Current Assets
loans and receivables 13 584,683 1,970,209 584,683 1,970,209
debt instruments at fair Value through
profit or loss 15 258,566 364,373 465,848 573,040
derivative financial assets 18 469,389 135,295 416,590 127,479
asset held for sale 9 - 453,559 - -
sundry debtors and deposits 19 208,888 132,620 110,581 166,869
trade receivables 20 2,546,594 2,725,153 2,407,595 2,676,535
deposits and placements With
financial institutions 21 9,463,718 7,534,385 9,463,718 7,534,385
cash and bank balances 21 3,383,526 2,337,832 2,797,116 1,617,120
16,915,364 15,653,426 16,246,131 14,665,637